![Featured image of post Java工程师 运维监控[02] PushGateway](/posts/java-engineer/devops/push-gateway/Snipaste_2024-08-27_11-14-21.png)
概述
Prometheus采集指标的两种方式
Prometheus 是一个非常流行的开源监控和警报工具,它可以帮助我们监控各种服务和系统的性能指标。在 Prometheus 的世界里,通常有两种方式来收集指标:拉(Pull)和推(Push)。
拉模式:这是 Prometheus 默认的工作方式。在这种模式下,Prometheus 会定期地去“拉取”(或者说“抓取”)它需要监控的目标(比如服务器、服务等)的指标数据。推模式:在某些情况下,我们可能希望被监控的目标主动“推送”(或者说“发送”)指标数据给 Prometheus。这就是 pushGateway 起作用的地方。
PushGateway 的作用原理
想象一下,你有一个应用程序,它在不同的时间段内会运行在不同的服务器上,或者它是一个短期运行的任务,比如一个批处理作业。在这些情况下,Prometheus 可能无法通过常规的拉模式来获取这些应用程序的指标,因为它们的位置不固定或者存在时间很短。
这时候,pushGateway 就派上用场了。它允许应用程序在运行时主动将自己的指标数据推送到 pushGateway。这样,Prometheus 就可以定期去 pushGateway 拉取这些指标数据,而不是直接从应用程序拉取。
pushGateway 工作模式总结为以下几点:
- 推送指标:应用程序在运行时,会将自己的性能指标推送到 pushGateway。这可以通过 Prometheus 的客户端库来实现,应用程序只需要调用相应的库函数,就可以将指标发送出去。
- 存储指标:pushGateway 接收到这些指标后,会暂时将它们存储起来。它会给这些指标分配一个唯一的标识符,
通常是应用程序提供的 job 名称和 instance 标识。 - 拉取指标:Prometheus 会定期去 pushGateway 拉取这些指标。Prometheus 通过查询 pushGateway 的 API,获取到所有存储的指标数据。
- 更新指标:如果应用程序再次推送相同的指标,pushGateway 会更新这些指标的最新值。
pushGateway 工作模式优点:
- 灵活性:应用程序可以在任何时候推送指标,而不需要 Prometheus 直接监控。
- 适用于短期任务:对于临时运行的任务或者不经常运行的服务,pushGateway 提供了一种有效的监控方式。
- 减少 Prometheus 服务器的负载:由于 Prometheus 不需要频繁地去拉取每个目标的指标,这可以减少 Prometheus 服务器的负载。
总结,pushGateway 像是 Prometheus 监控系统中的一个中转站,它允许不固定或短期运行的应用程序能够方便地将它们的性能数据推送给 Prometheus 进行监控。
部署PushGateway(使用Docker)
(1)docker pull prom/pushgateway
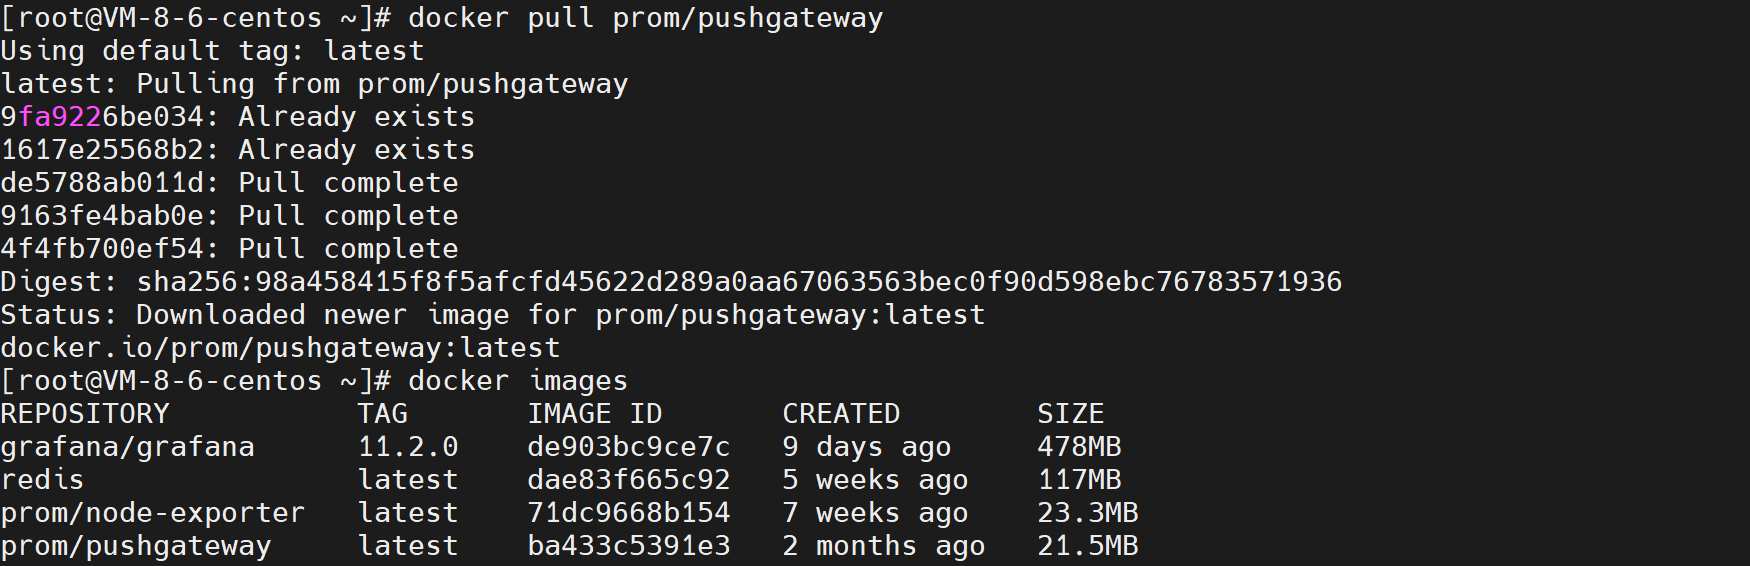
(2)docker run -d -p 9191:9091 --name=pushgateway prom/pushgateway

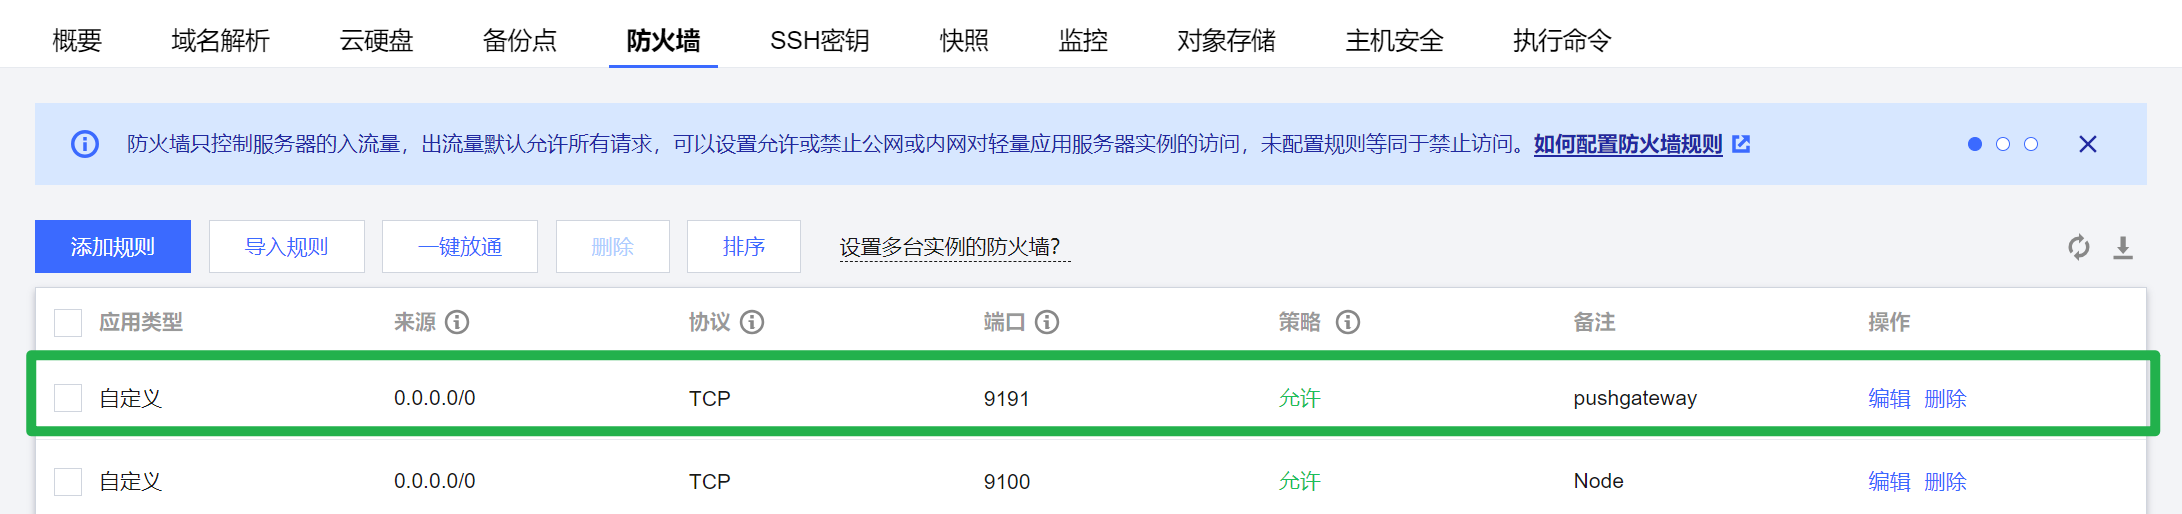
(3)服务器端口打开
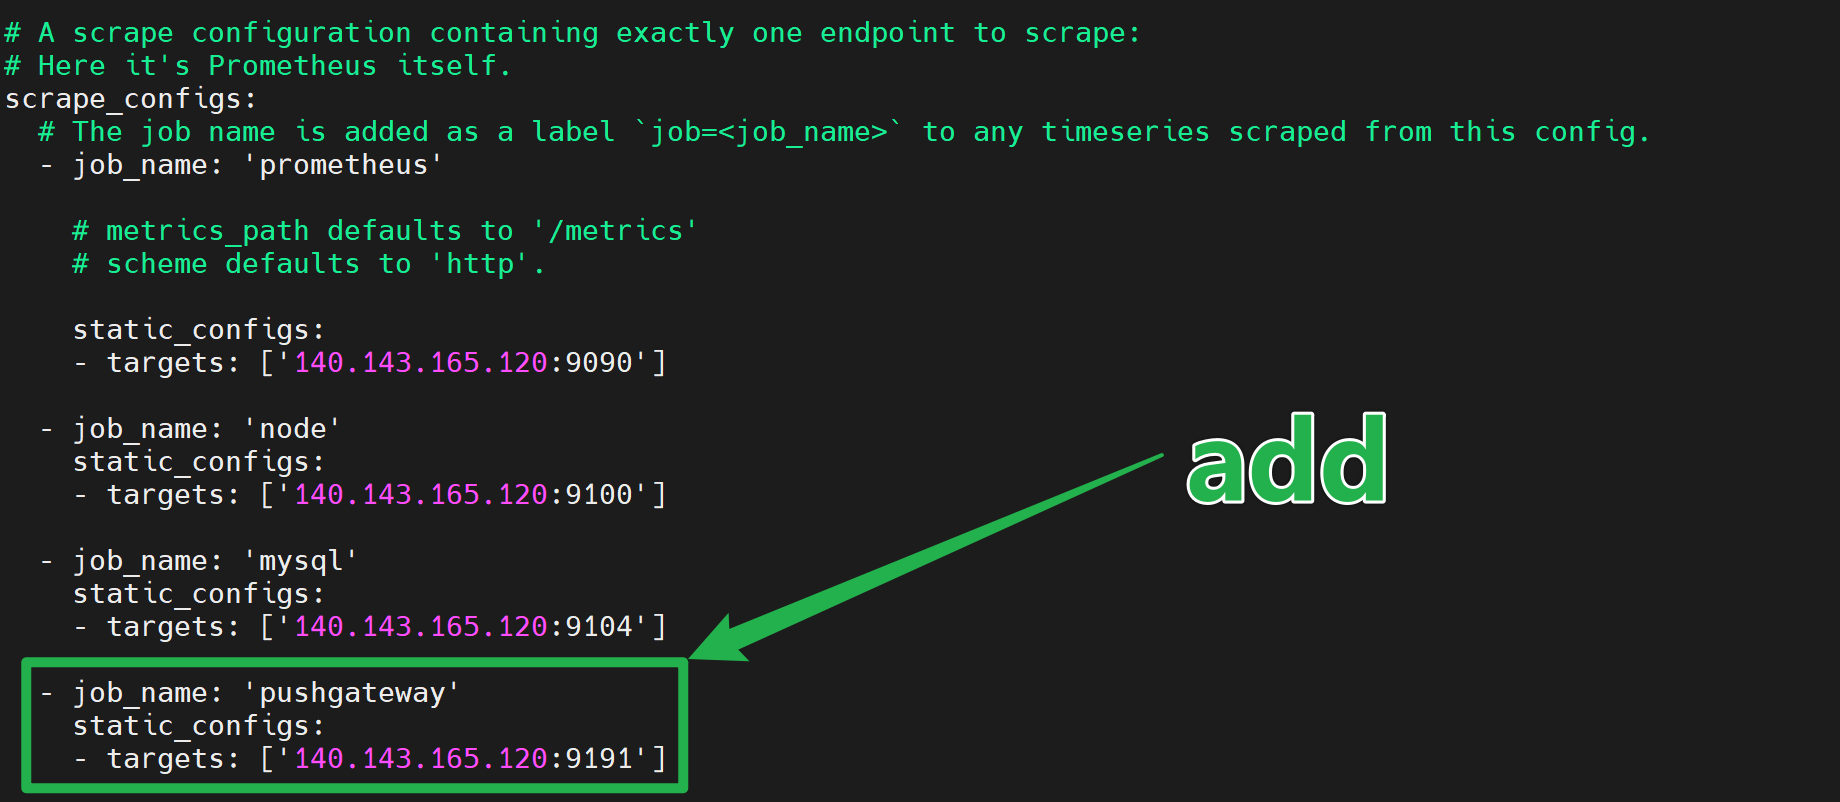
(4)Prometheus拉取数据配置
(5)重启Prometheus

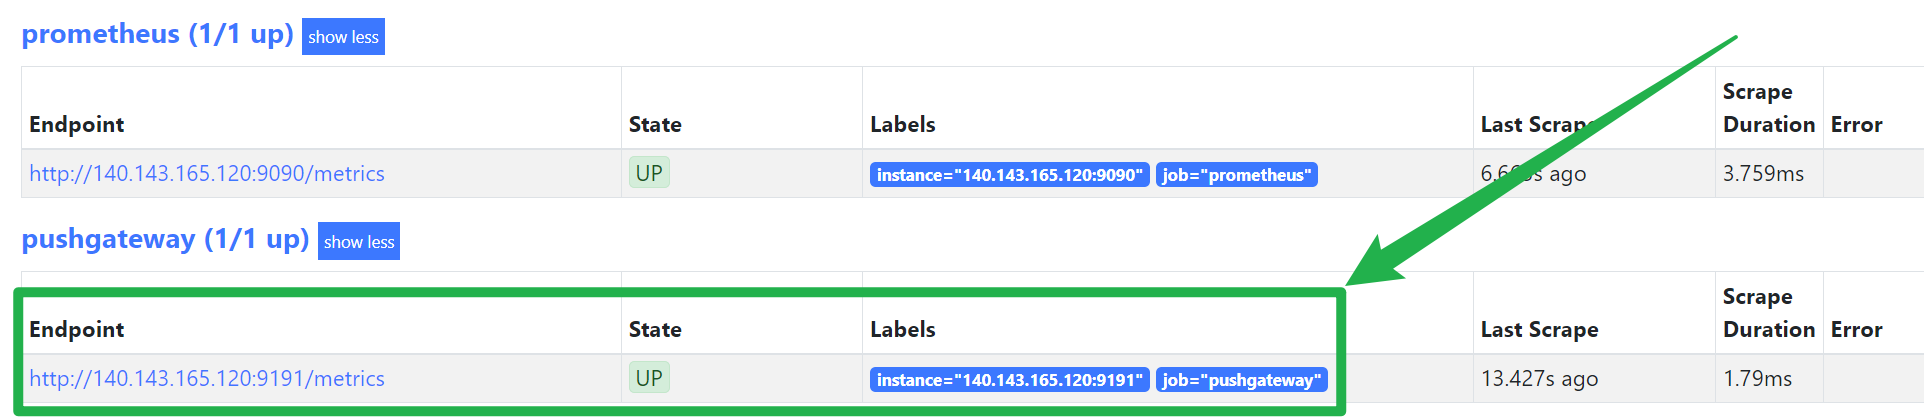
(6)访问Prometheus的Target
SpringBoot项目定时向PushGateway推送数据
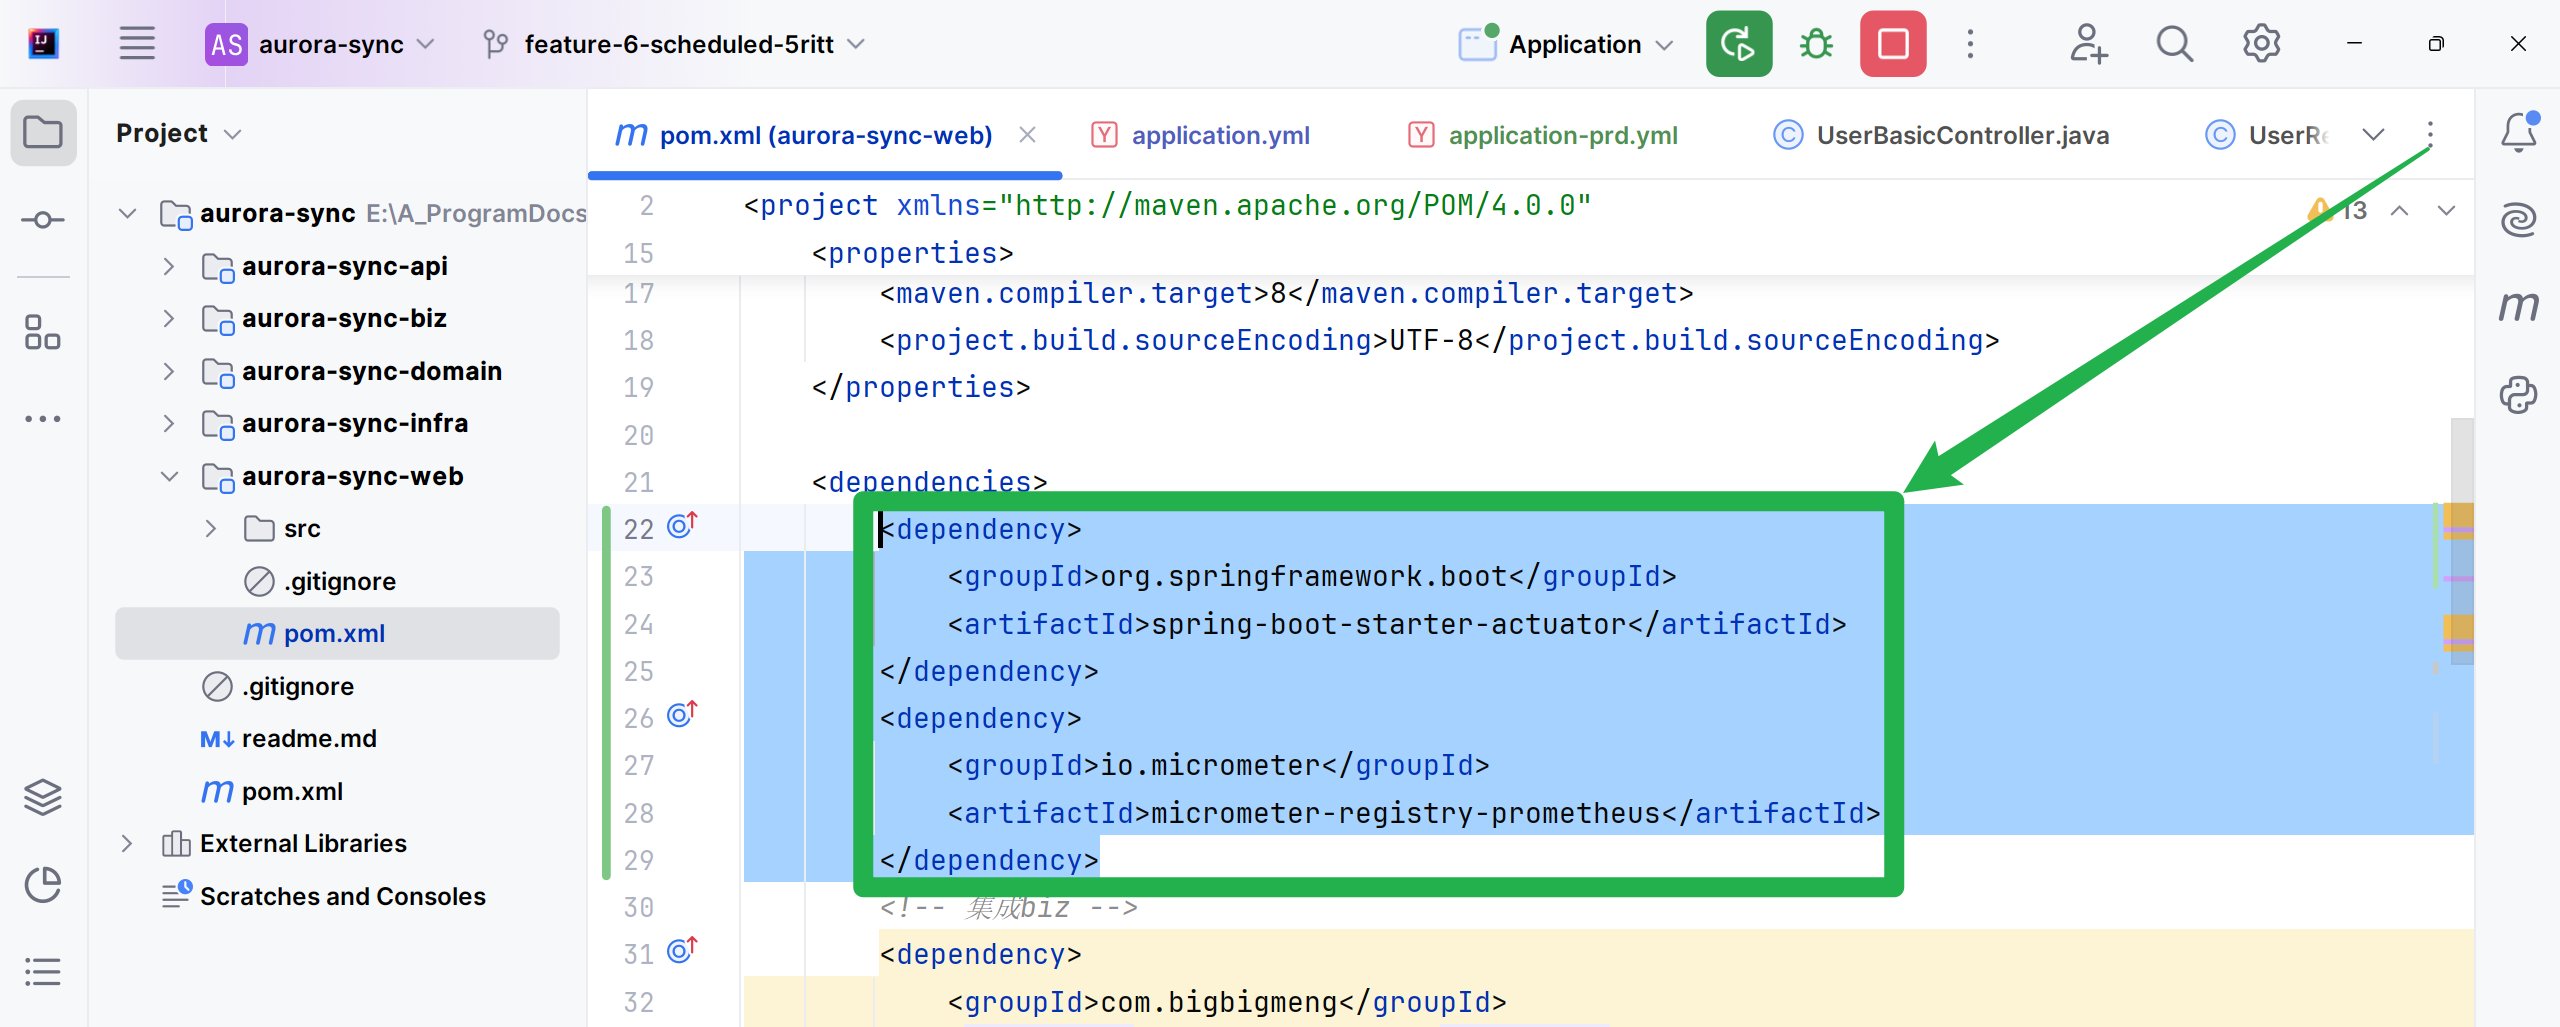
(1)引入依赖:在pom.xml文件中,添加Spring Boot Actuator和Micrometer Prometheus Registry的依赖
<!-- 指标推送(截屏内容次要参考) -->
<dependency>
    <groupId>org.springframework.boot</groupId>
    <artifactId>spring-boot-starter-actuator</artifactId>
</dependency>
<dependency>
    <groupId>io.micrometer</groupId>
    <artifactId>micrometer-registry-prometheus</artifactId>
</dependency>
<dependency>
    <groupId>io.prometheus</groupId>
    <artifactId>simpleclient_servlet</artifactId>
</dependency>
<dependency>
    <groupId>io.prometheus</groupId>
    <artifactId>simpleclient_pushgateway</artifactId>
</dependency>
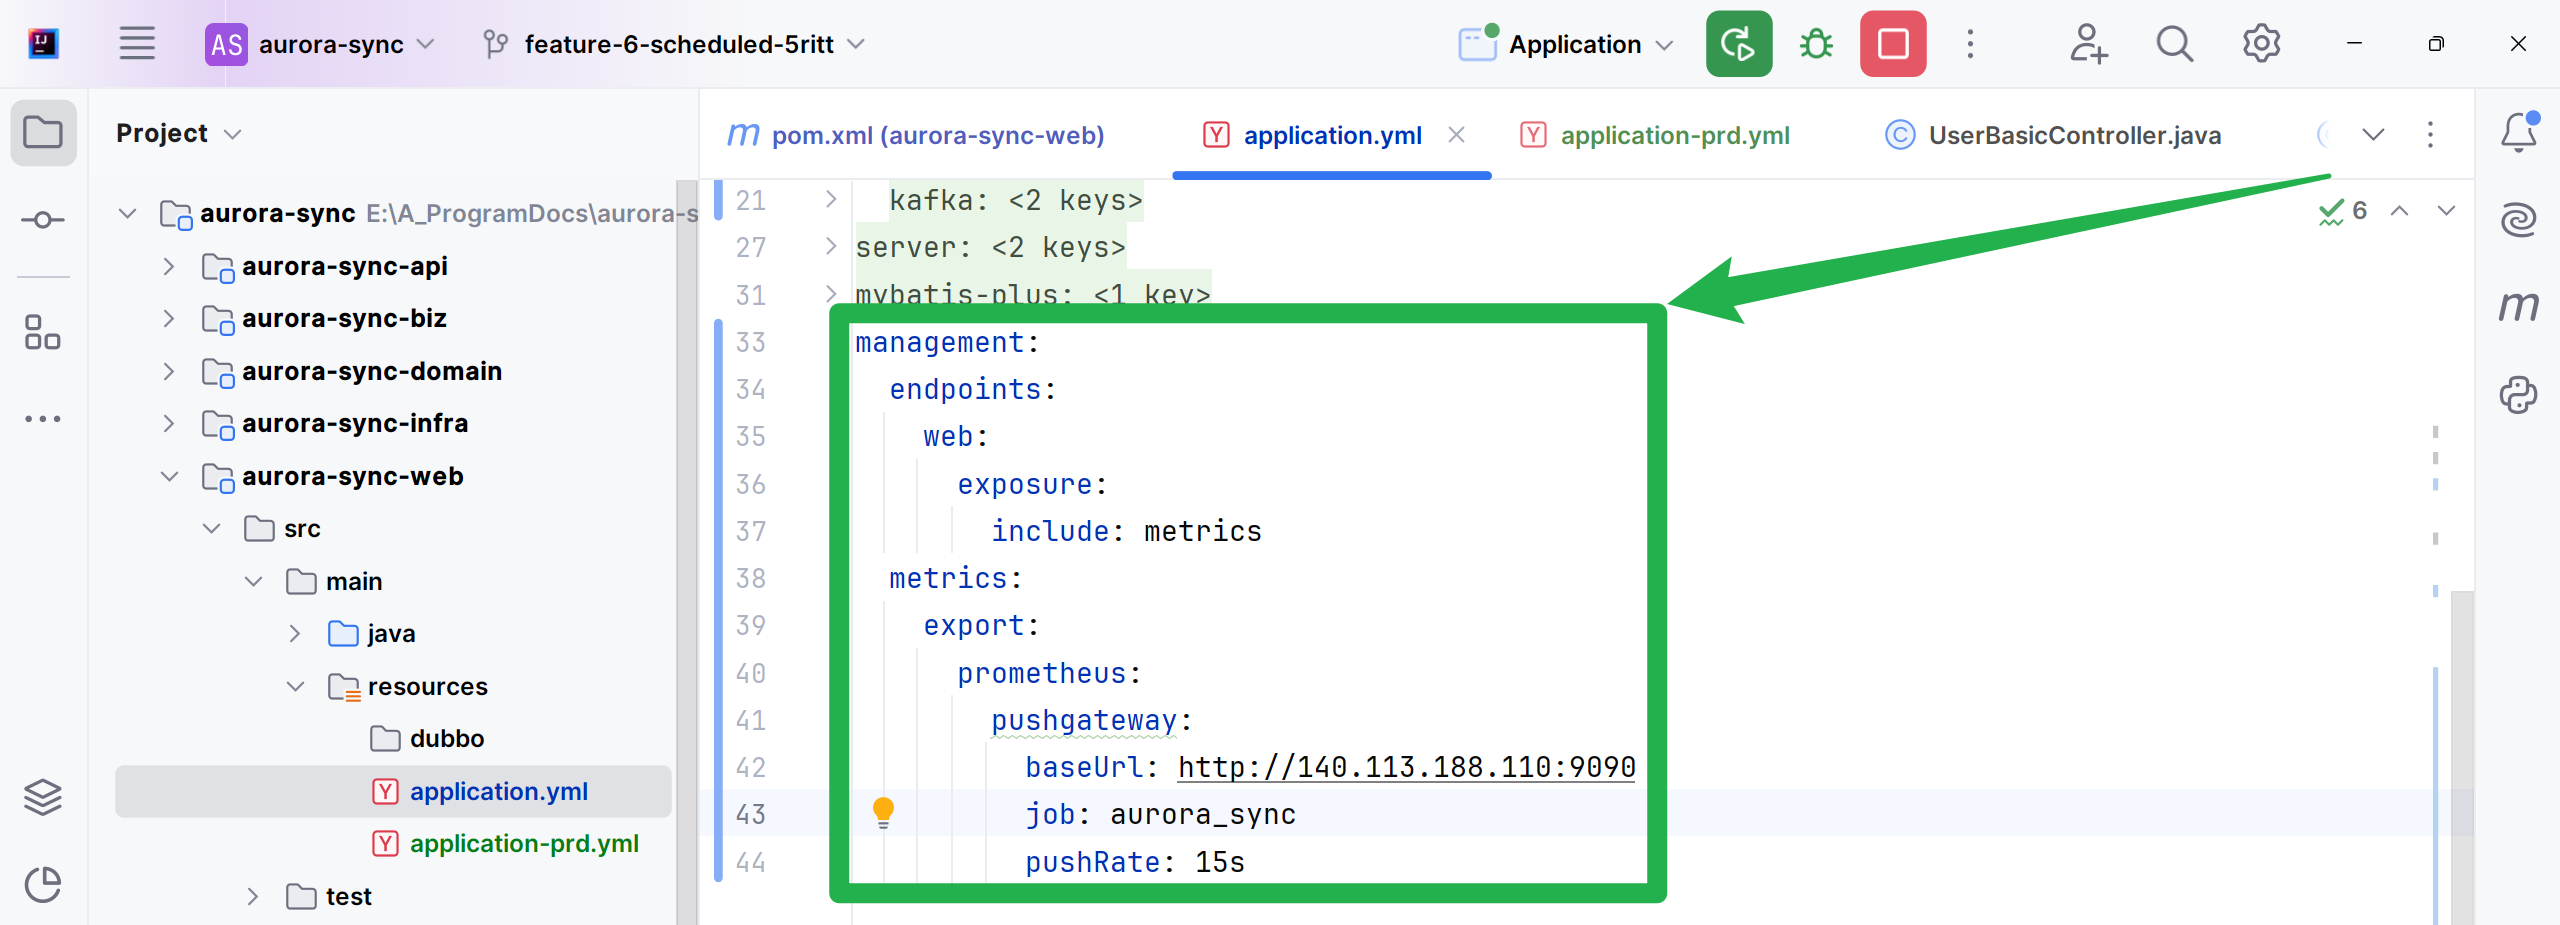
(2)配置应用: 在application.yml文件中,添加以下配置来暴露Prometheus指标端点:
#截屏中的内容次要参考
management:
  endpoints:
    web:
      exposure:
        include: metrics
  metrics:
    tags:
      application: ${spring.application.name}
    export:
      prometheus:
        pushgateway:
          #job定义名
          job: ${spring.application.name}
          #enabled设置为true表示启用自动推送
          enabled: true
          #pushGateway的地址
          baseUrl: http://140.143.111.120:9191
          #推送的频率
          pushRate: 5s
推送指标
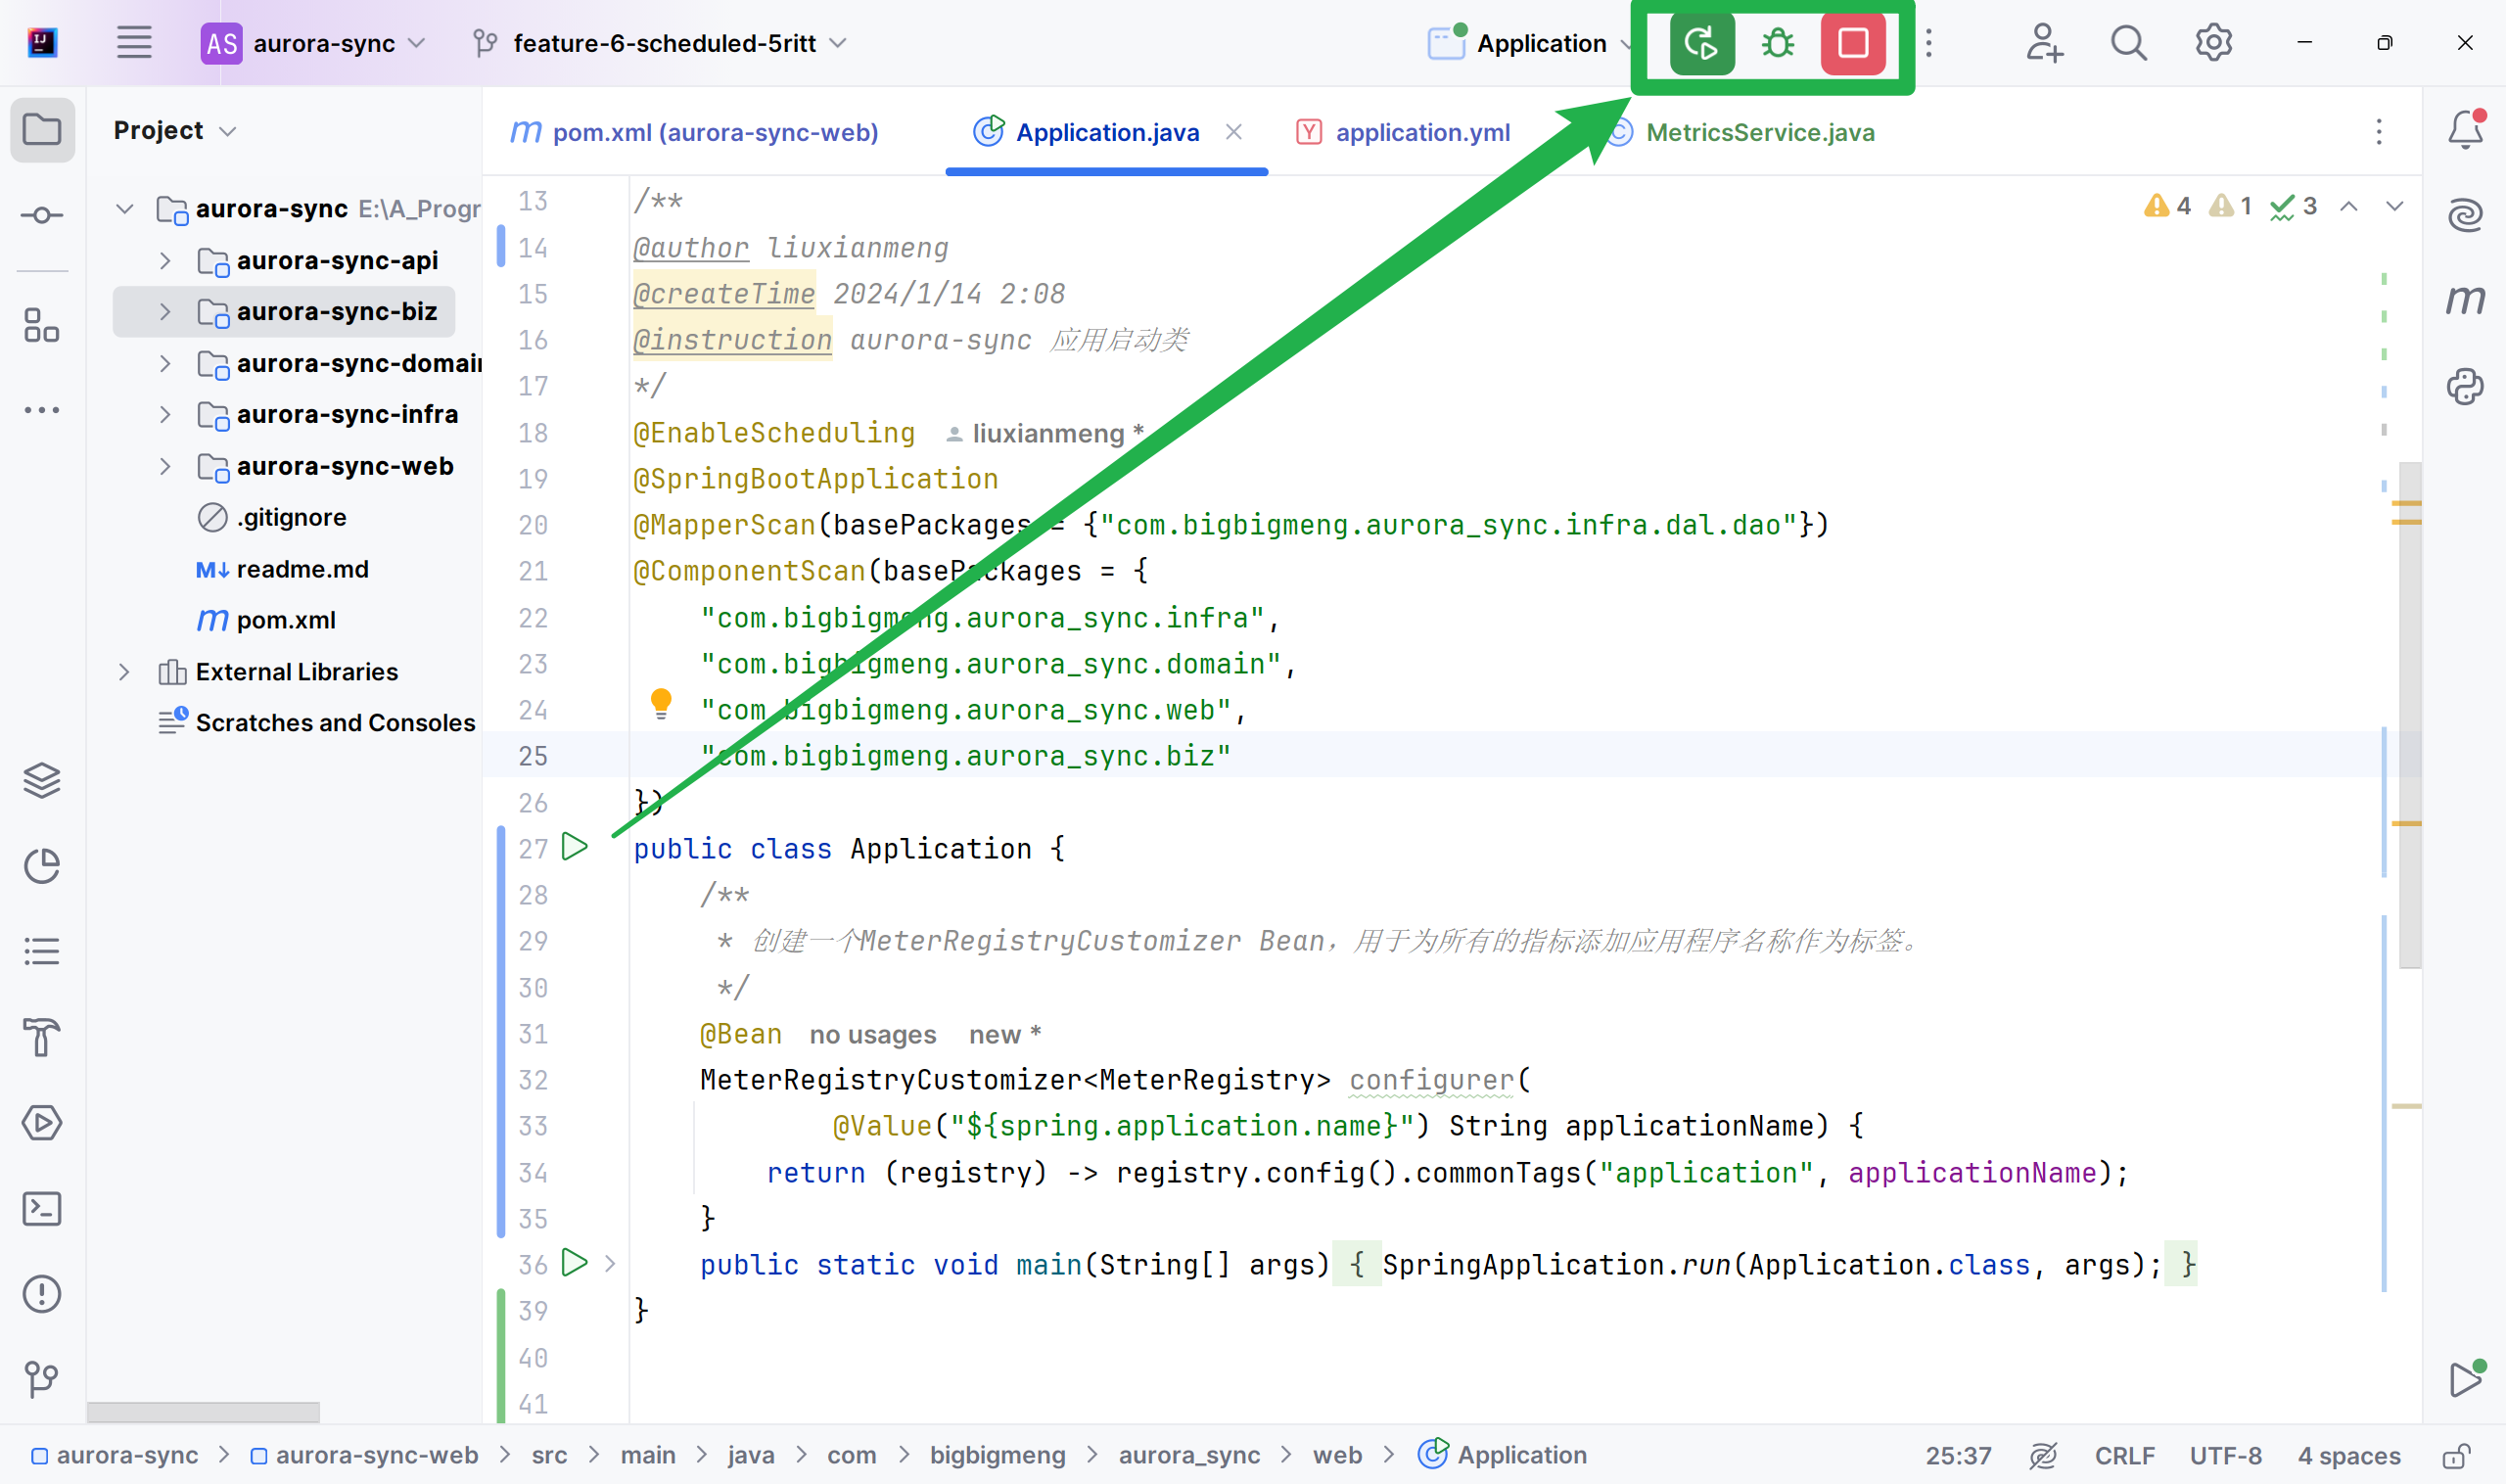
创建一个MeterRegistryCustomizer Bean
public class Application {
    /**
     * 创建一个MeterRegistryCustomizer Bean,用于为所有的指标添加应用程序名称作为标签。
     *
     * @param applicationName Spring Boot应用的名称,从application.properties或application.yml中获取。
     * @return MeterRegistryCustomizer对象,用于配置MeterRegistry。
     */
    @Bean
    MeterRegistryCustomizer<MeterRegistry> configurer(
            @Value("${spring.application.name}") String applicationName) {
        return (registry) -> registry.config().commonTags("application", applicationName);
    }
    public static void main(String[] args) {
        SpringApplication.run(Application.class, args);
    }
}
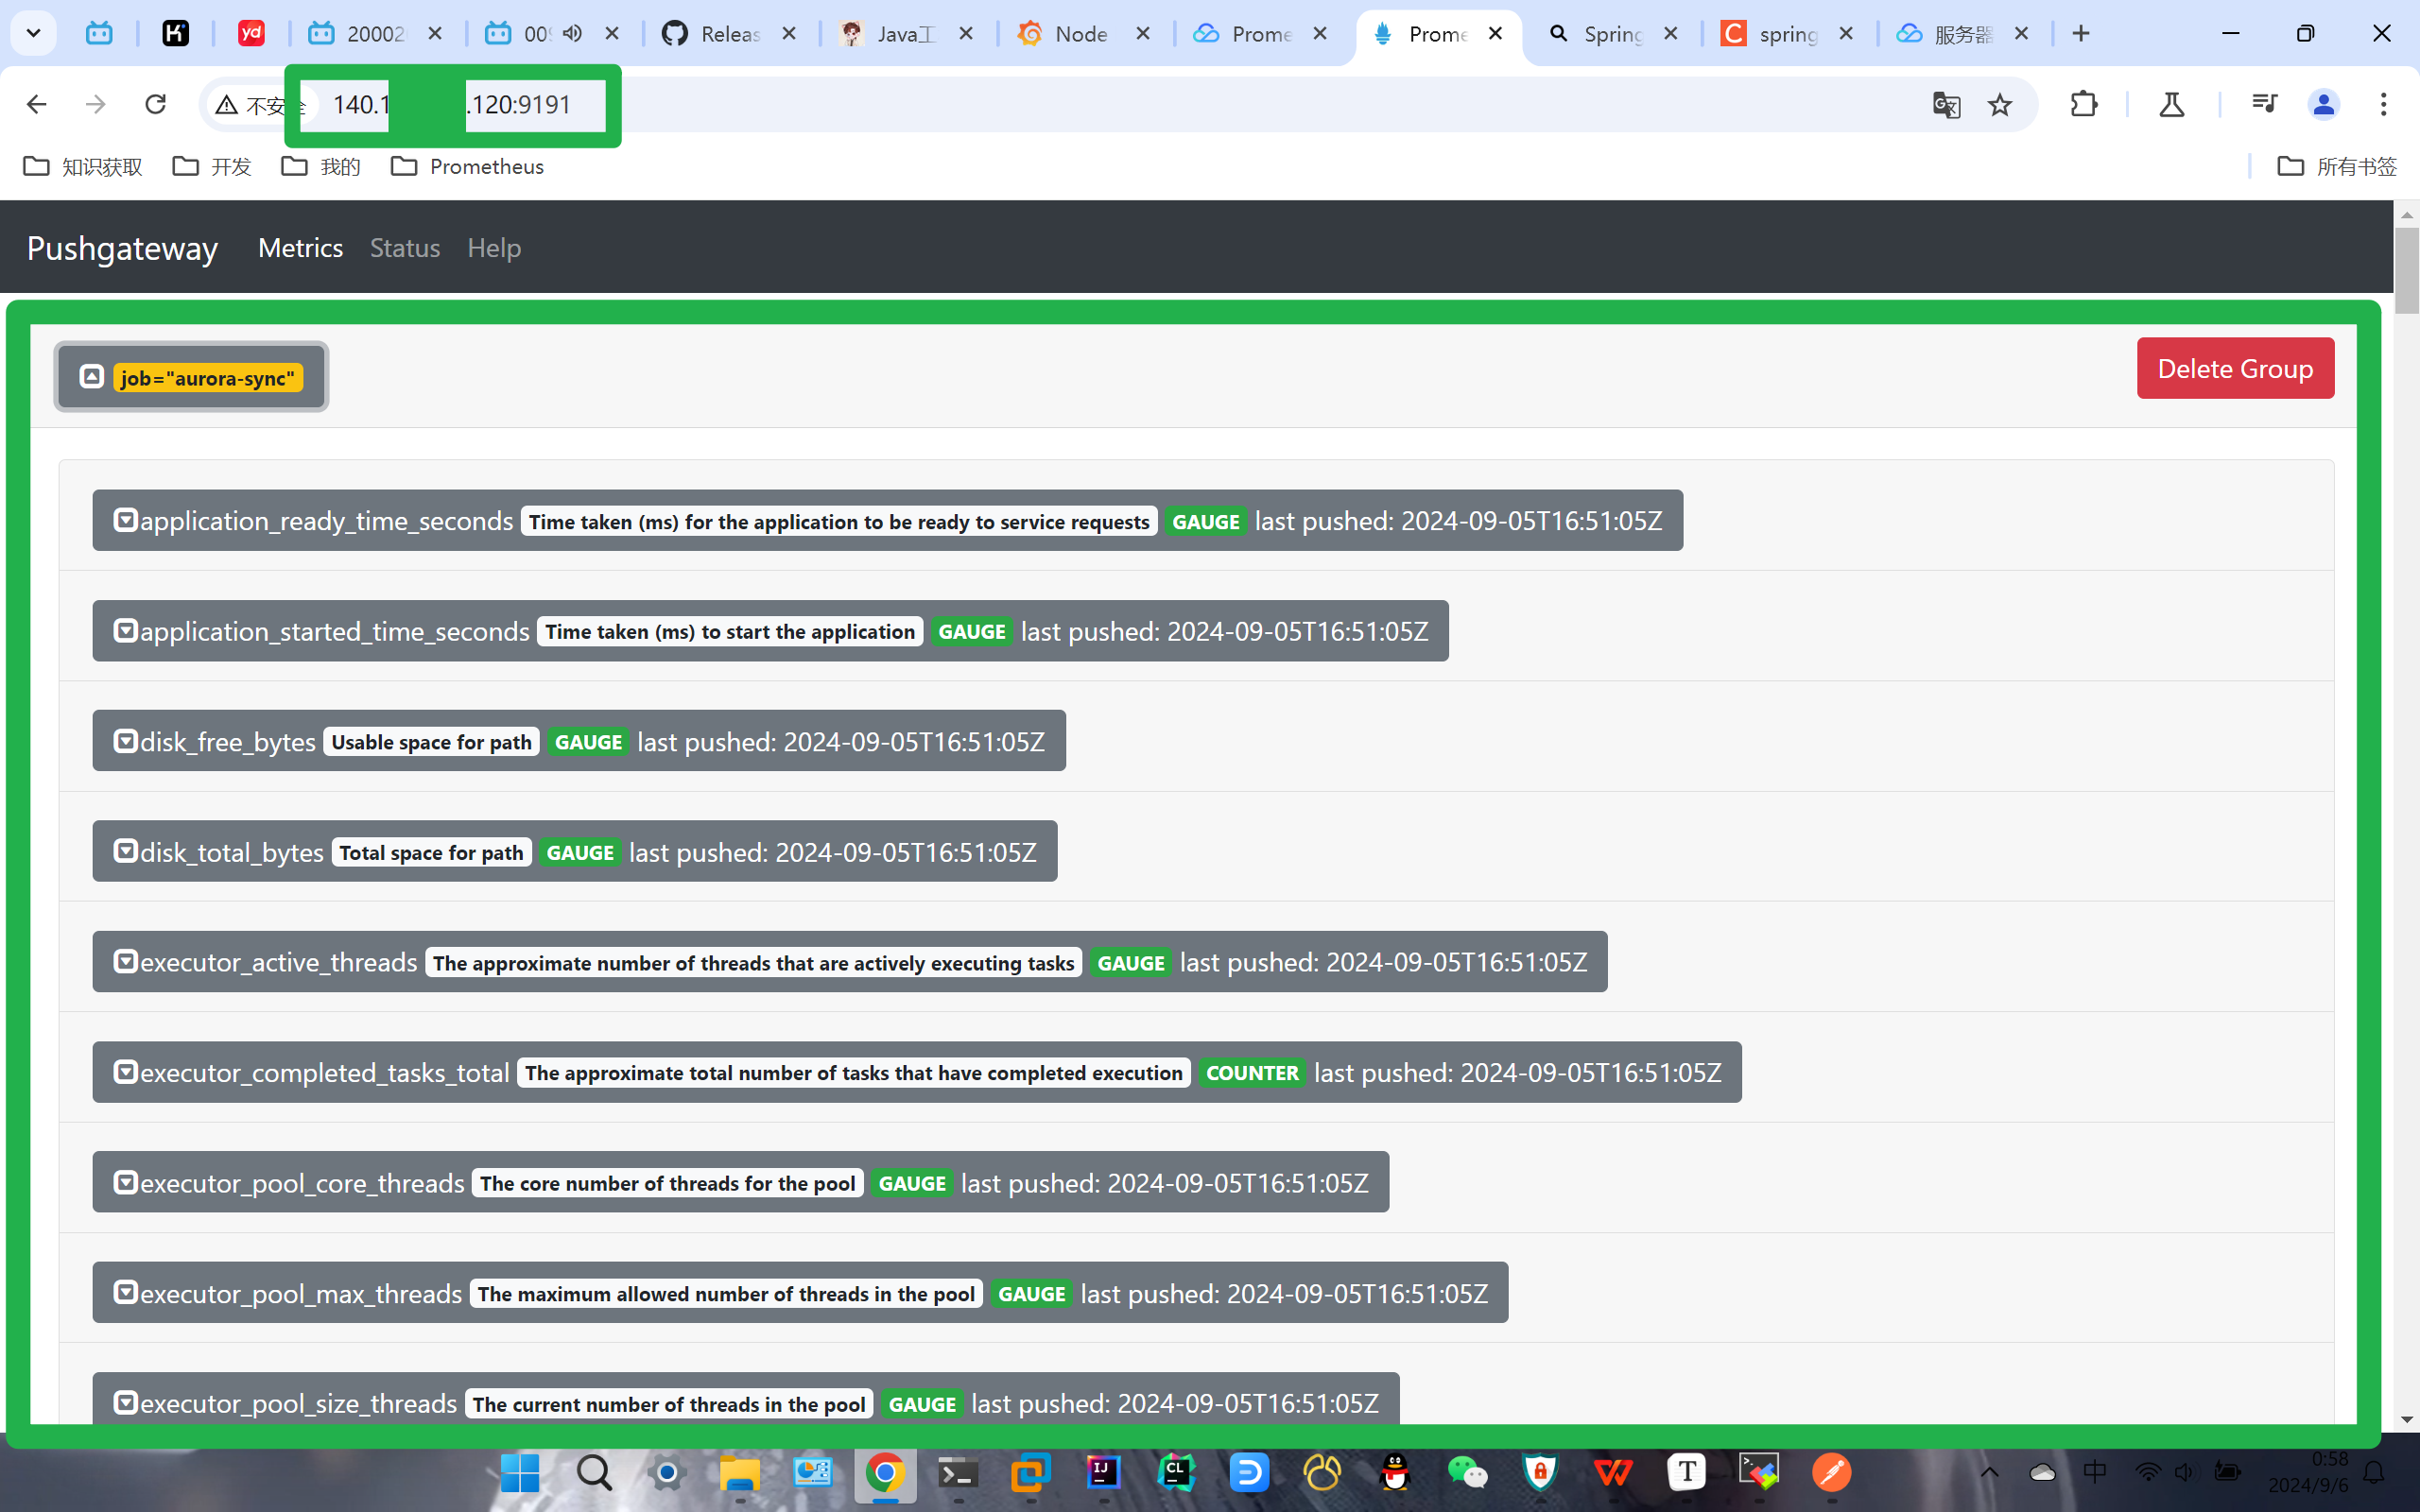
重新启动项目
访问页面
SpringBoot项目的数据被成功推送~
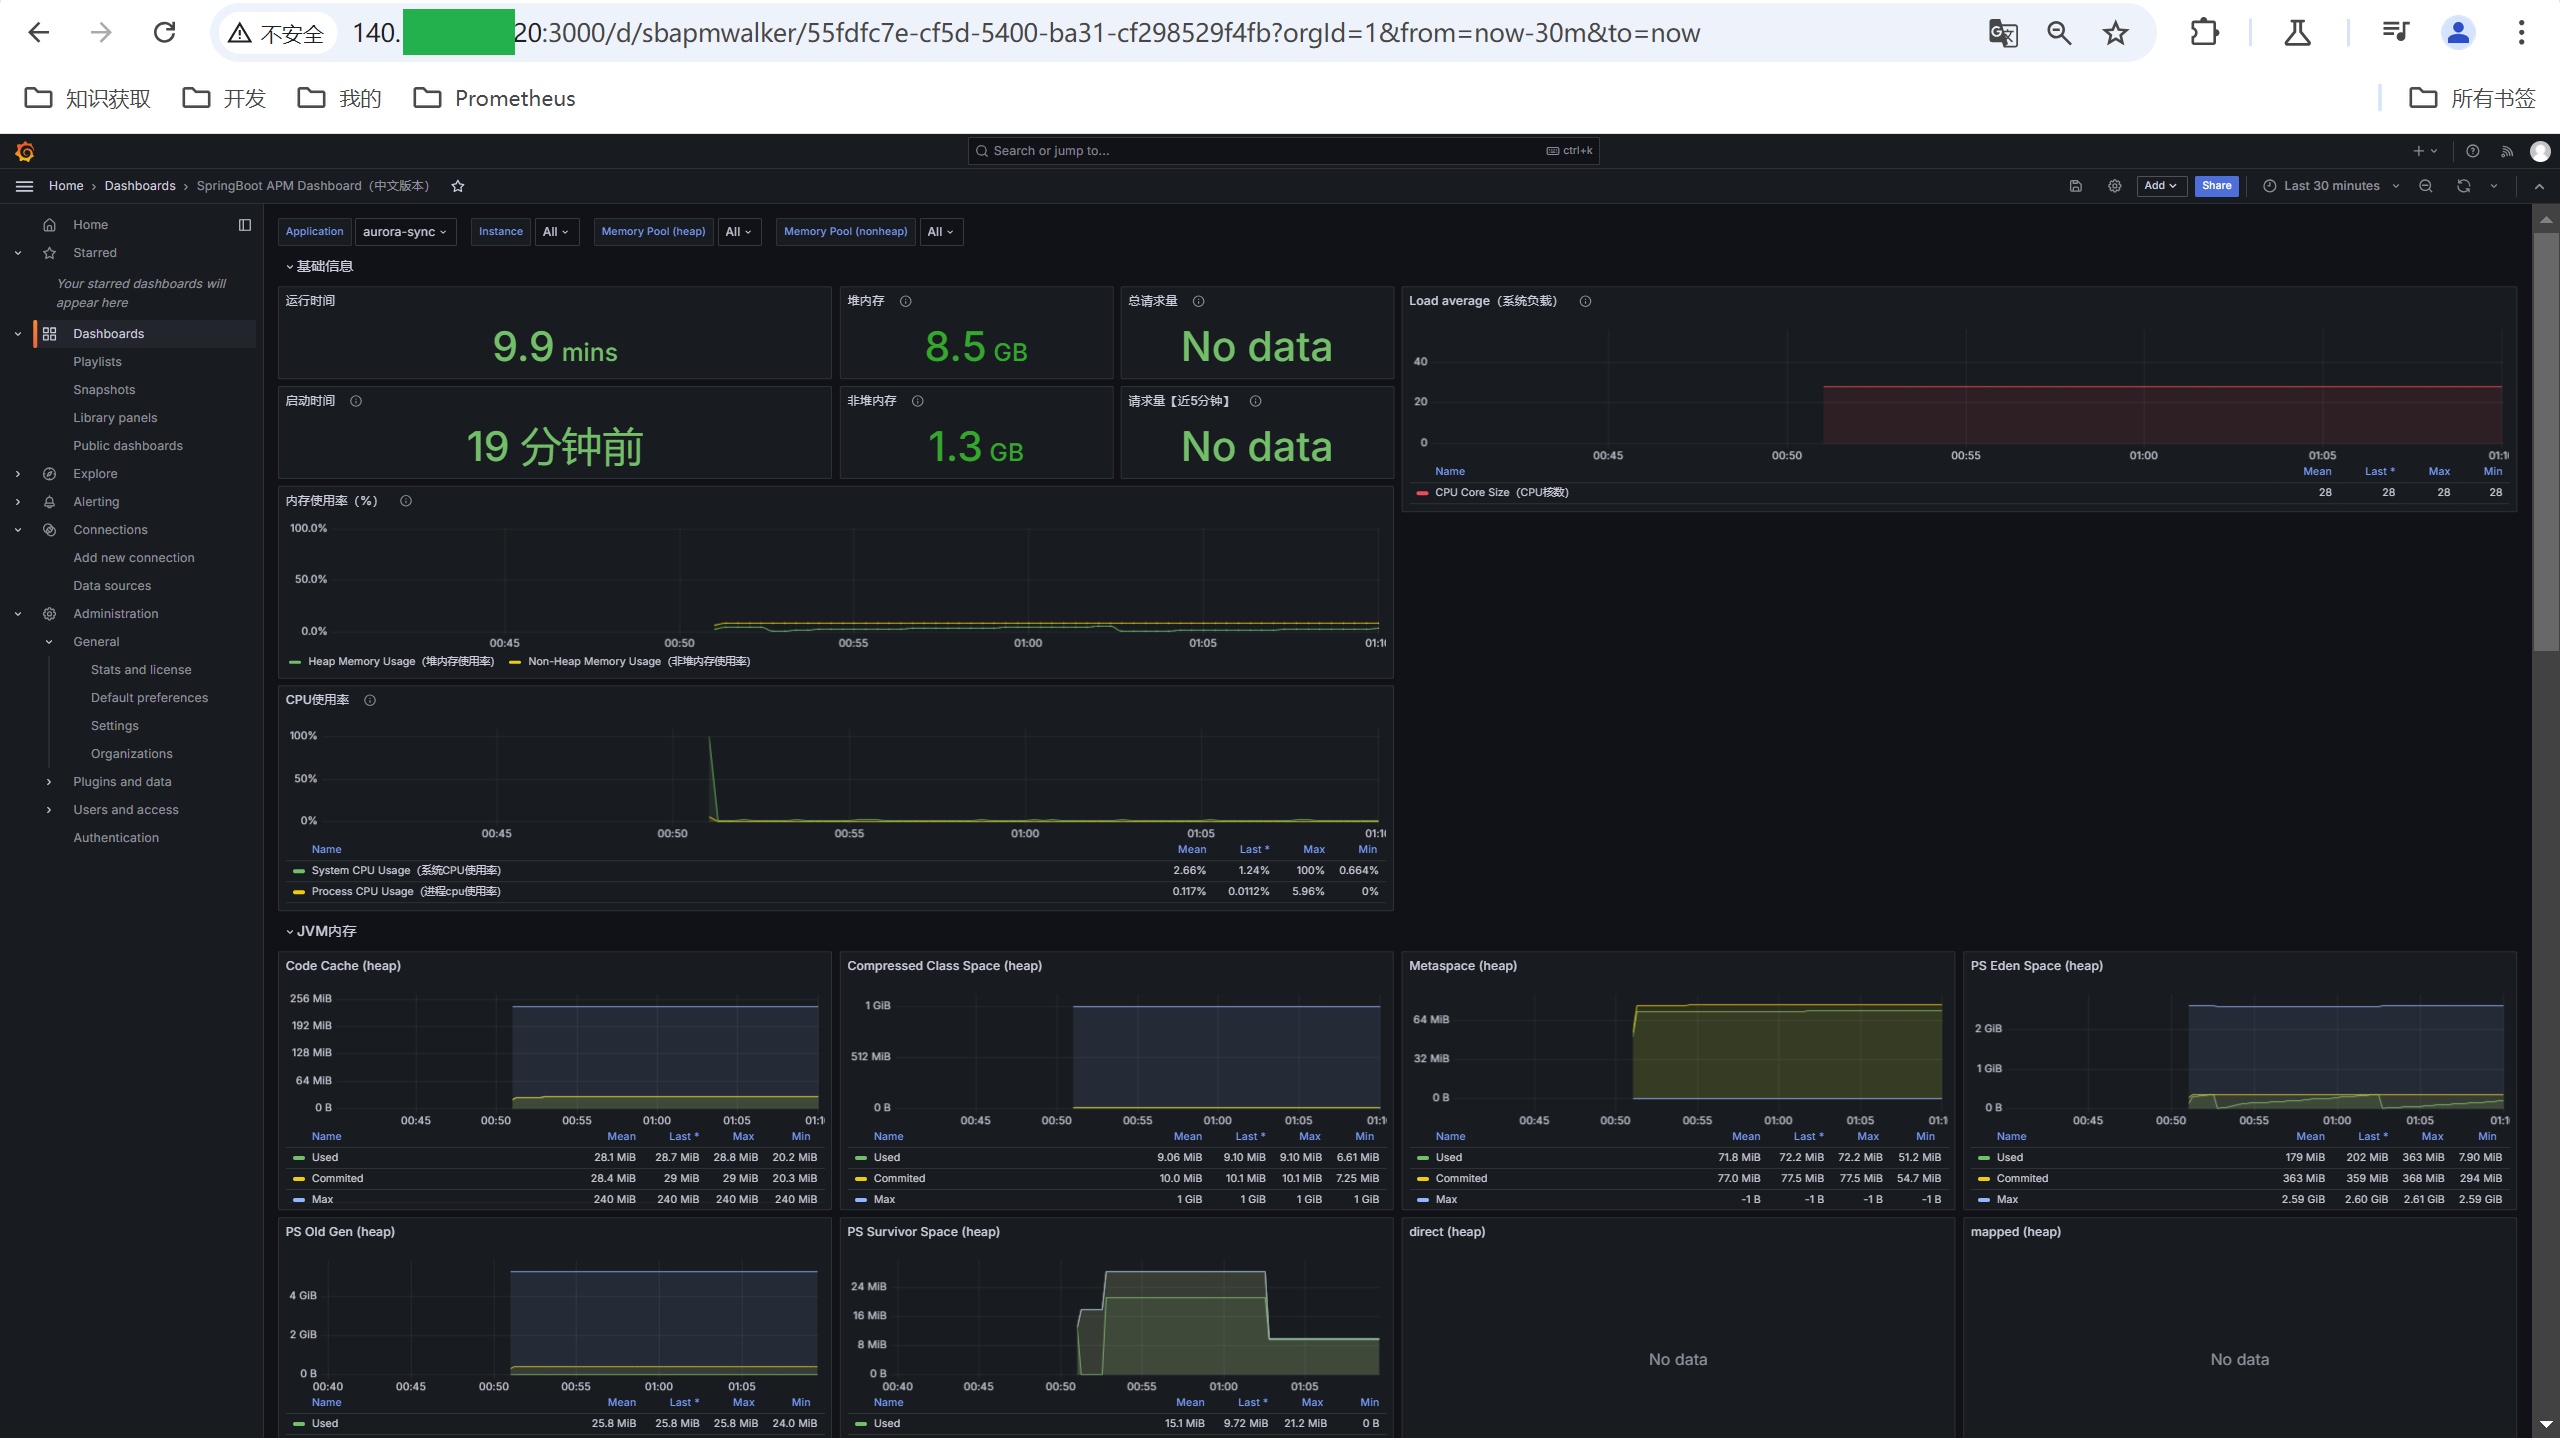
Grafana展示仪表盘
上一节已经成功将SrpingBoot项目的metrics推送到PushGetway,接下来在Grafana上进行展示
(1)访问Grafana页面
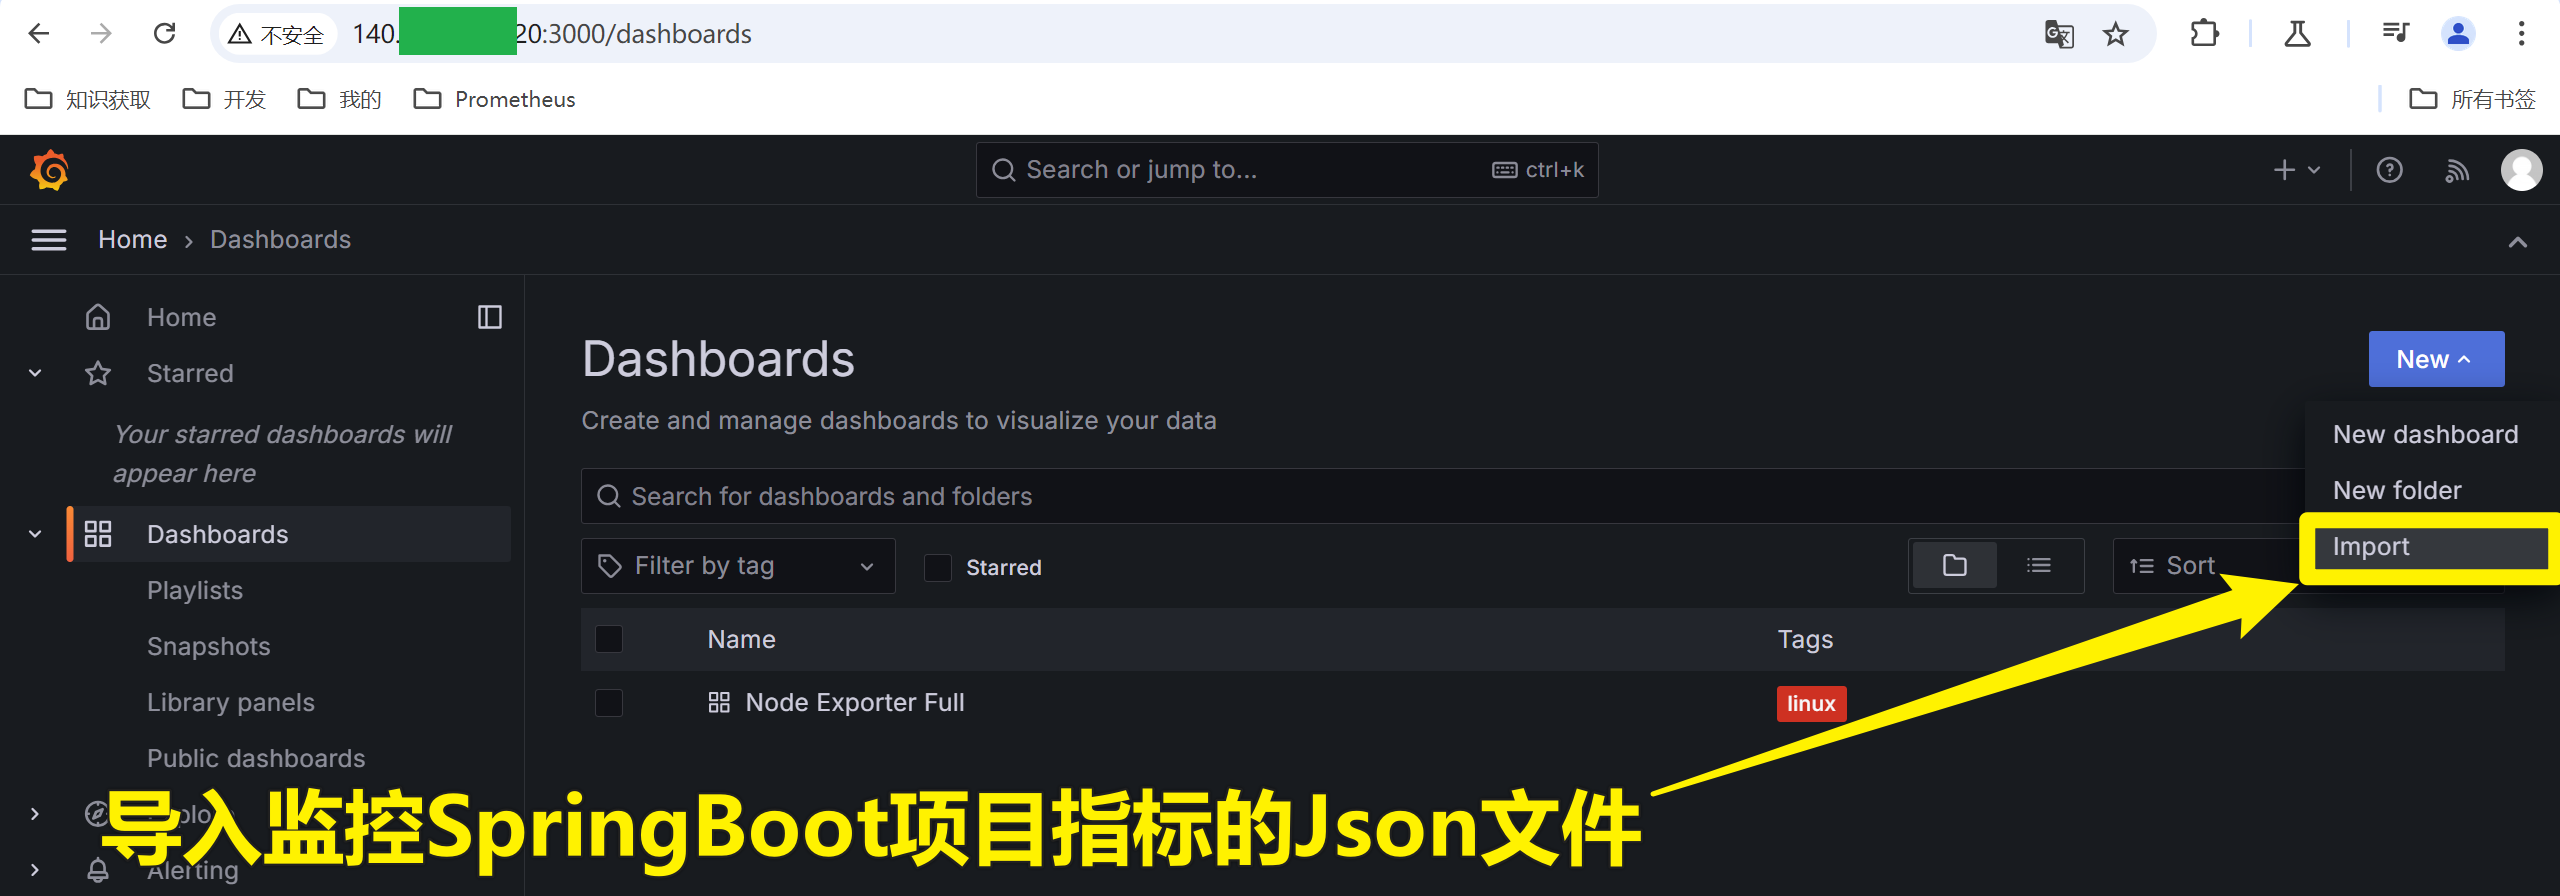
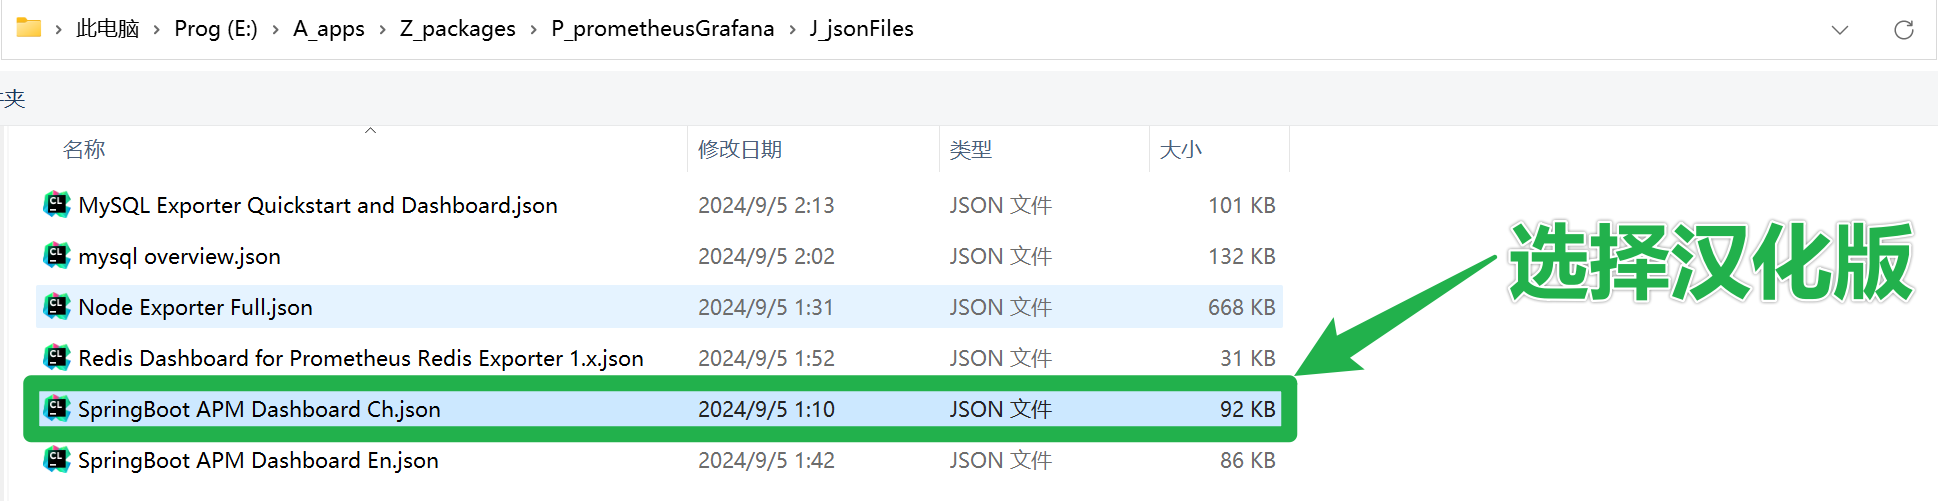
(2)导入:这里的json文件可在https://grafana.com/grafana/dashboards下载
(3)结果
参考文章列表
[1] Linux集群监控部署: prometheus 普罗米修斯 + Grafana(超详细)